Safe harbor statement
- Except for historical information, the matters discussed in this presentation may contain forward-looking statements that are subject to risks and uncertainties. These risks and uncertainties could cause the forward-looking statements and OmniVision’s actual results to differ materially. In evaluating these forward-looking statements, you should specifically consider various factors, including the factors listed in the “Risk Factors” section of the Company’s most recent annual report filed on Form 10-K and most recent quarterly reports filed on Form 10-Q. These factors may cause the Company’s results to differ materially from any forward-looking statement. Forward-looking statements are only predictions and actual events or results may differ materially.
- OmniVision disclaims any obligation to update information contained in any forward-looking statement.
Agenda
- Company overview Shaw Hong, CEO
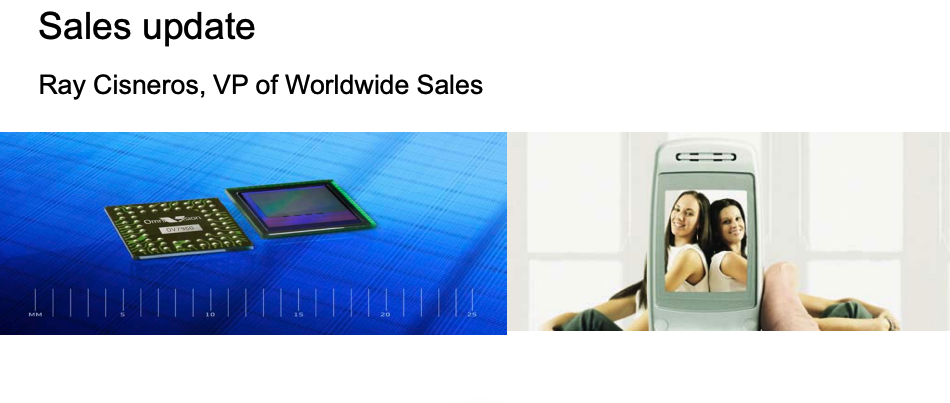
- Sales update Ray Cisneros, VP of Worldwide Sales
- Market leadership Bruce Weyer, VP of Worldwide Marketing
- Financial results Anson Chan, CFO
- Summary Shaw Hong, CEO
About OmniVision Technologies, Inc.
- World’s leading CMOS image solutions provider
– Pioneered CMOS image sensor industry (1995)
– IPO July, 2000 – Nasdaq: OVTI
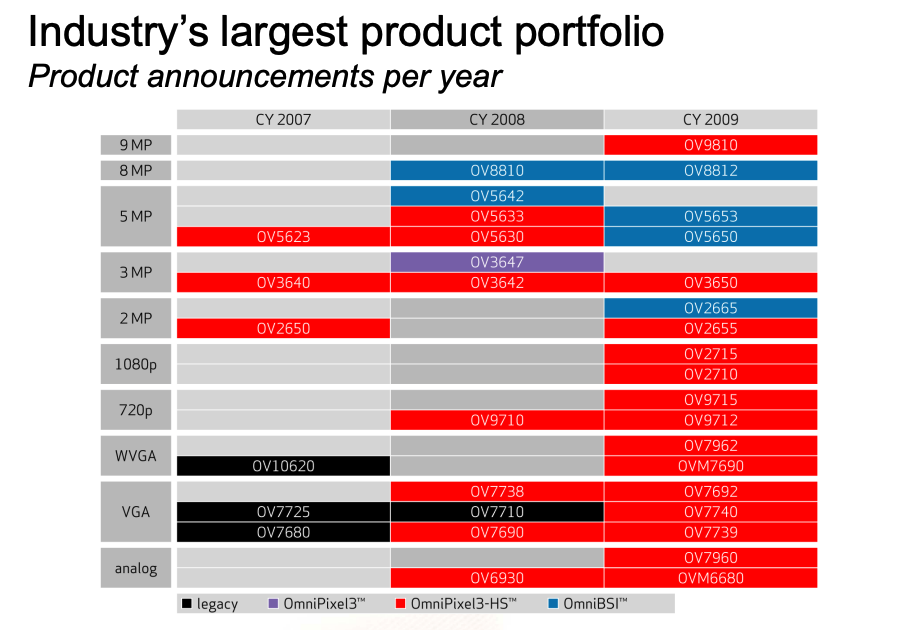
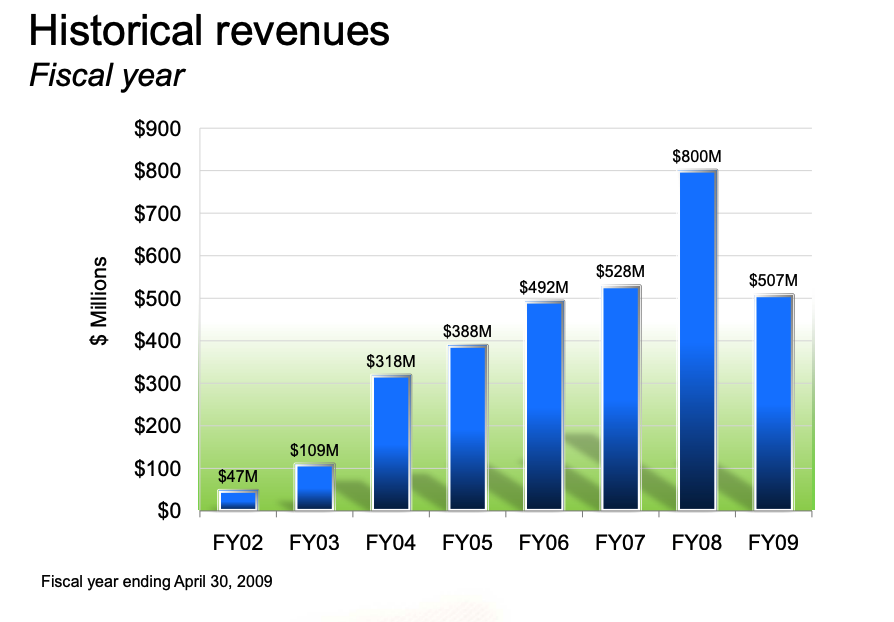
– Industry’s broadest product portfolio - $507M in revenues (fiscal year ending April 30, 2009)
– Record year $800M in fiscal 2008 (prior to downturn) - Approximately1,300 employees worldwide
- Exceptional financial position
– $309M in cash and short-term investments at July 31, 2009
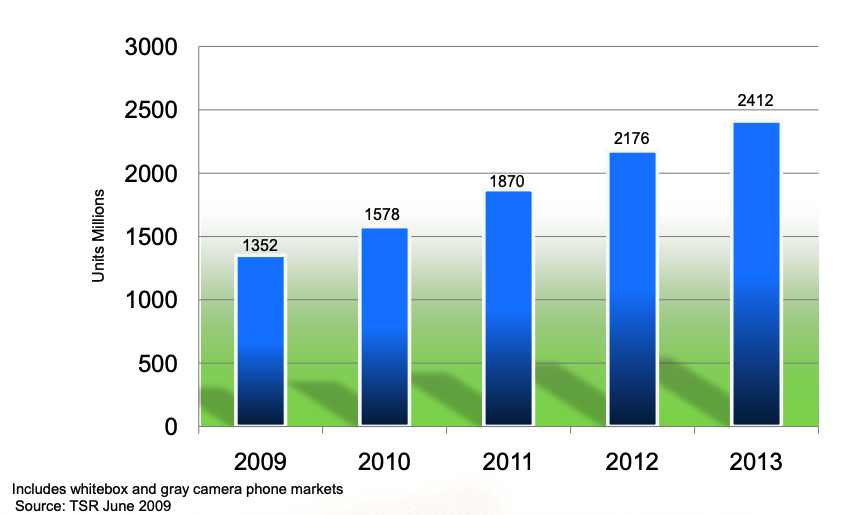
Growing addressable market opportunity
CMOS shipment forecast — all markets
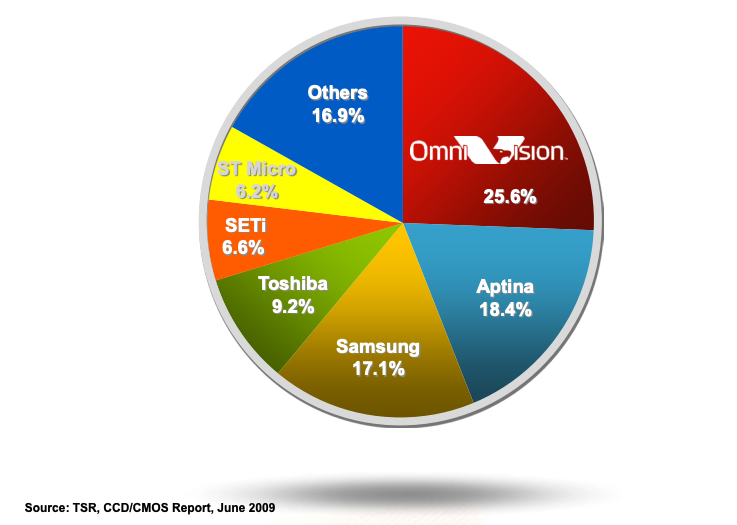
Leading market share position
CY 2008 CMOS unit shipments
Technology leadership
- Best-in-class pixel technology
– OmniPixel®3-HS
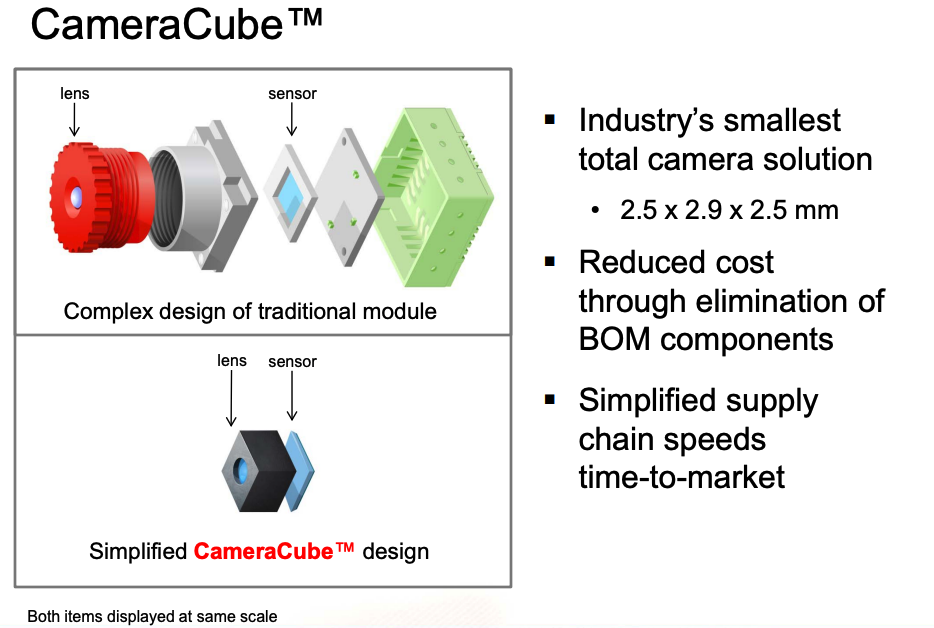
– OmniBSI™ - World’s most advanced packaging technology
– CameraCube™
OmniPixel®3-HS
- True-to-life color reproduction
- High sensitivity
– Up to 960 mV/lux-sec – 1.75 µm pixels
– Up to 3.3 V/lux-sec – 3 µm pixels
– Up to 12 V/lux-sec – 6 µm pixels - Quality exceeds CCD sensors
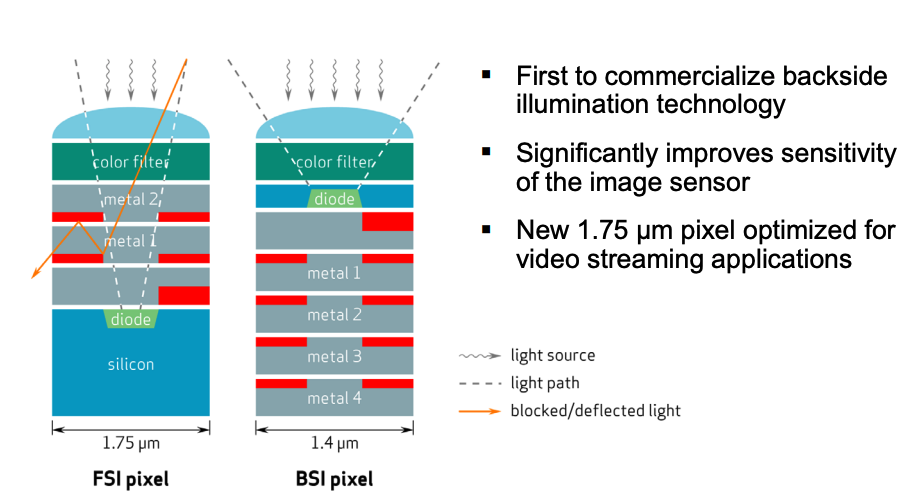
OmniBSI™
Backside Illumination Technology
Scalable supply chain

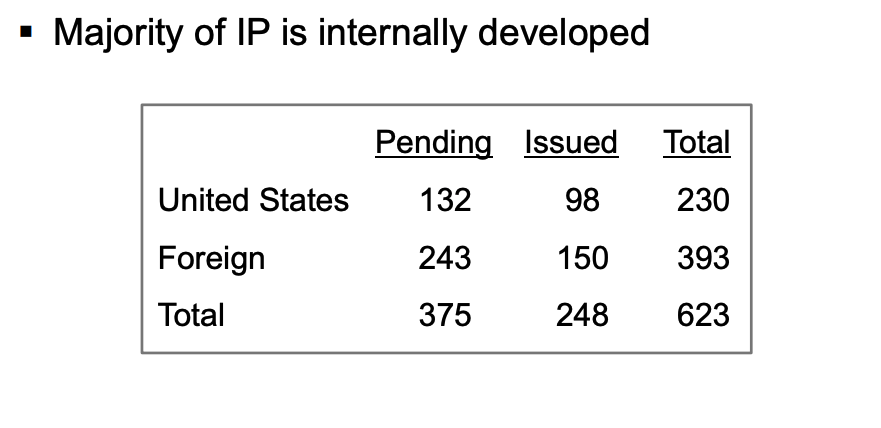
IP portfolio
Sales update and accomplishments
Fiscal year 2009
- Planning and execution countered severe economic recession
– Generated $507M in revenues
– Shipped 337M units - Prepared for future growth
– Focused on design work with key new customers – contributing to FY2010 results
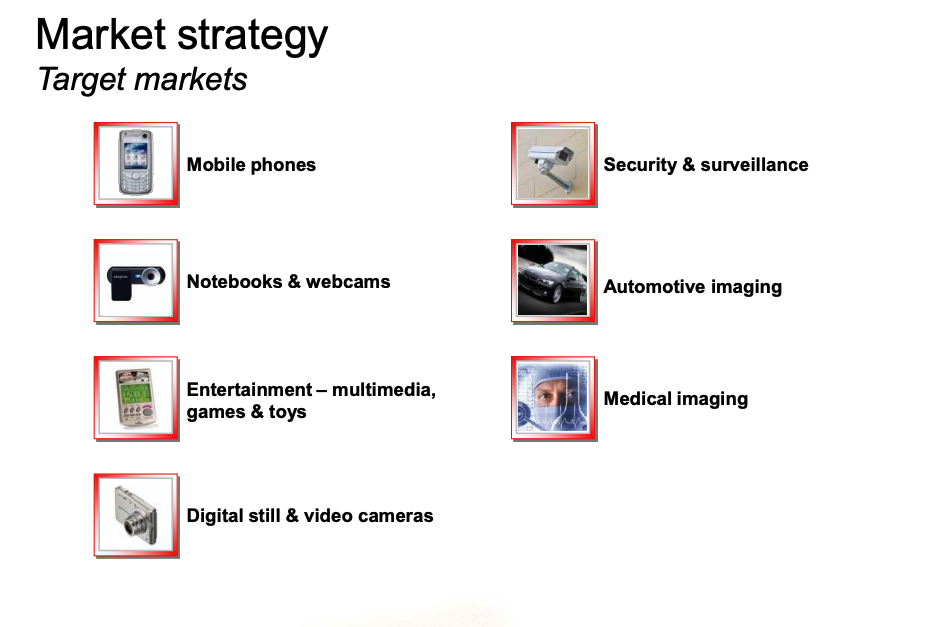
– Market place continued to develop new applications – multi-media devices, MID’s and netbooks
– Existing applications continued to expand – rise of the smart phone category
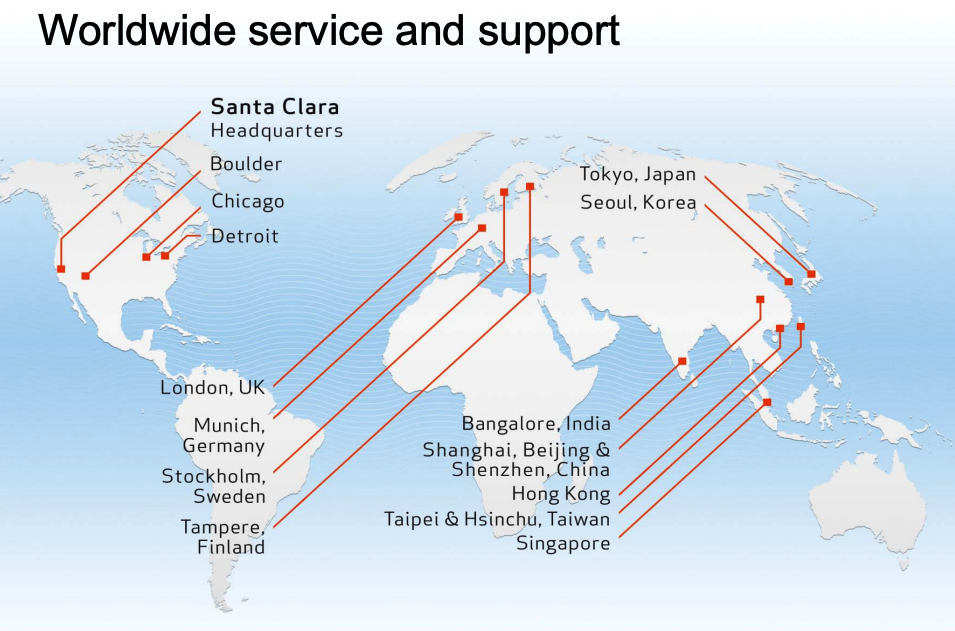
– Regional demand continued to develop – opened sales office in India
Sales update and accomplishments
Fiscal year 2010 and going forward
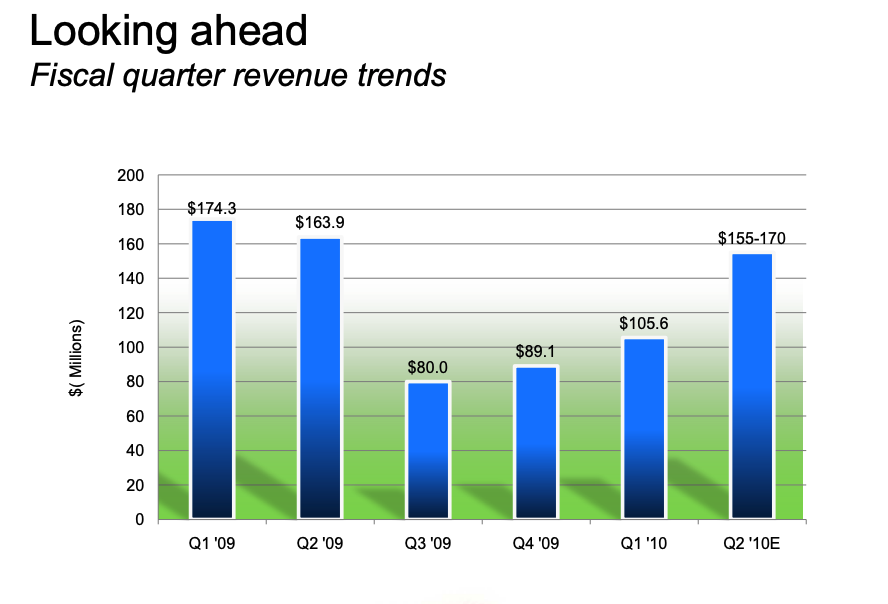
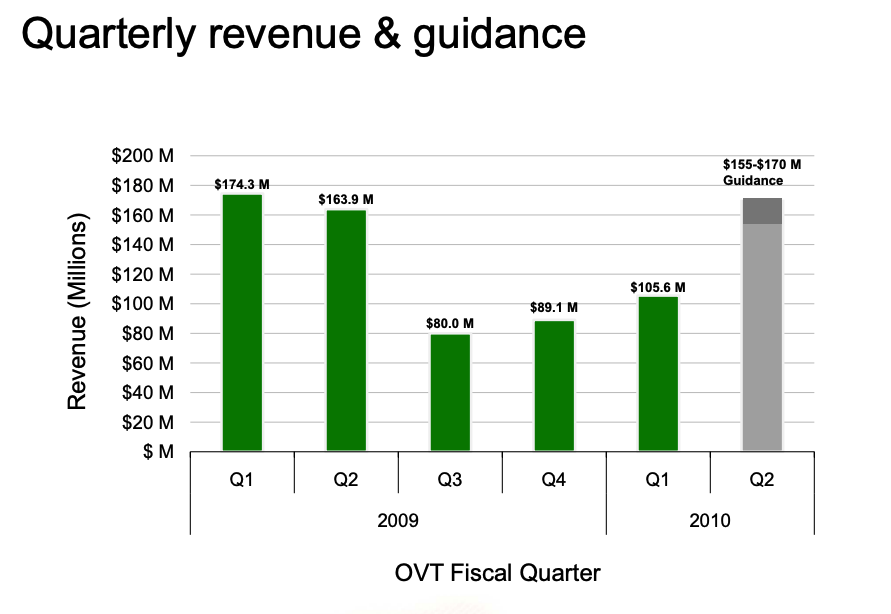
- Quarterly revenue trend is on an upswing
– Reported Q1FY10 of $105.6M
– Provided Q2FY10 guidance of $155M – $170M
– All regions show renewed strength - Strengthened position in Tier 1 accounts driving the smart phone category
– 2 and 3 mega pixel sensors shipping in volume
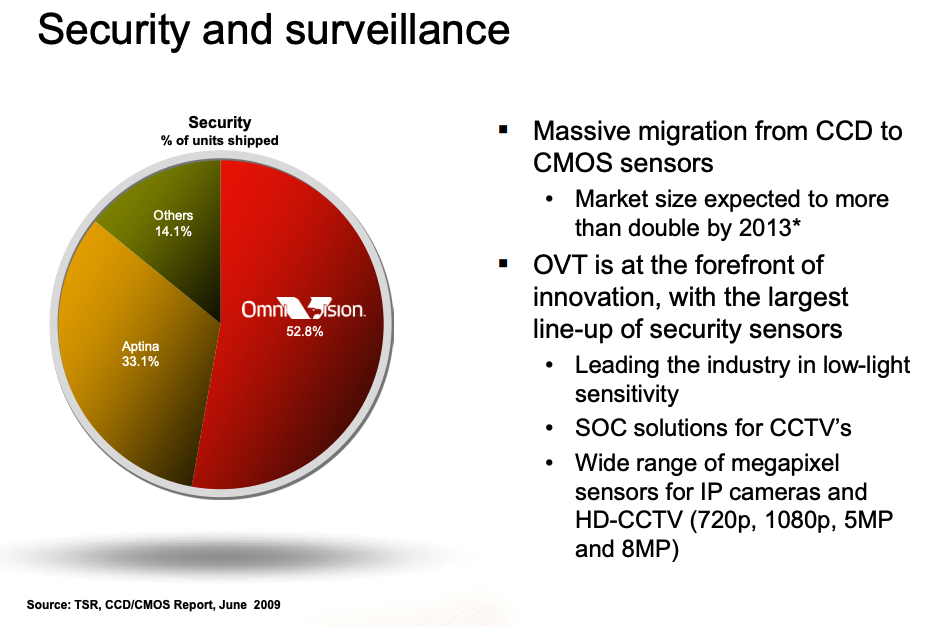
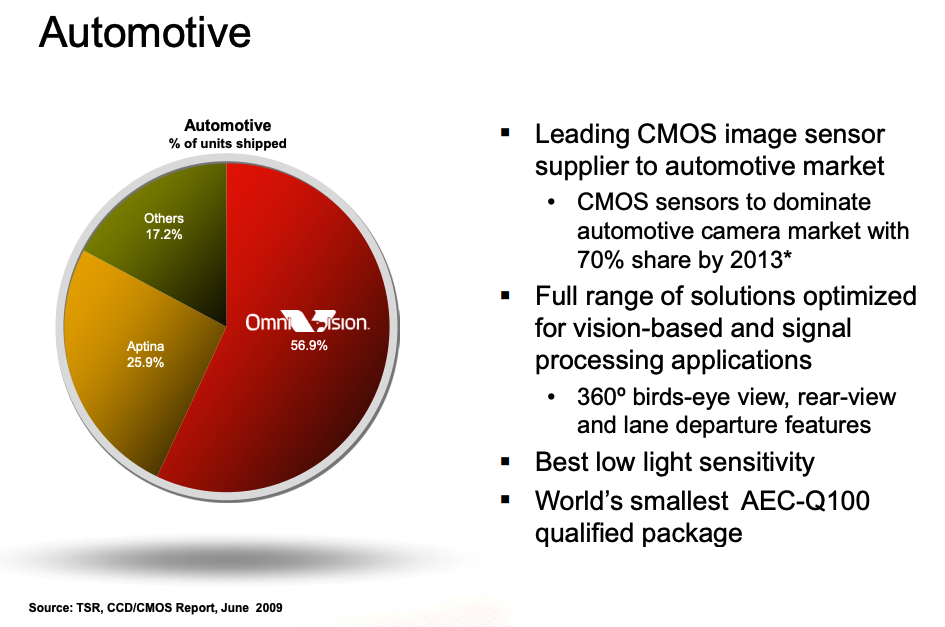
– 5 megapixel design wins are next - Continued to dominate a growing PC/Notebook market
- Total product mix to higher resolutions trending upwards
- Asia first to ramp BSI 5-megapixel SoC and shift to higher resolution
- Penetrated Japan market with BSI 8 megapixel design for DV application

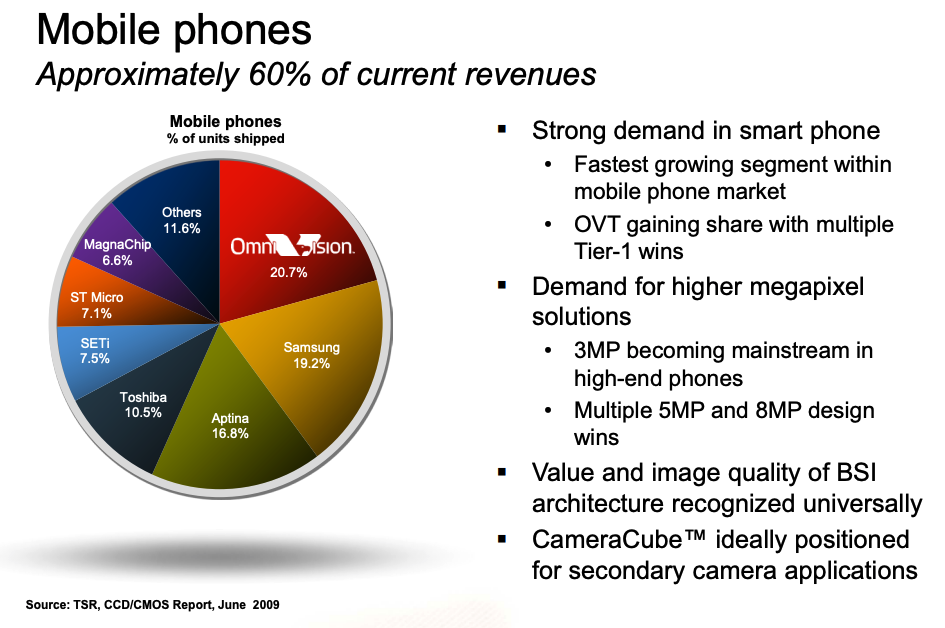
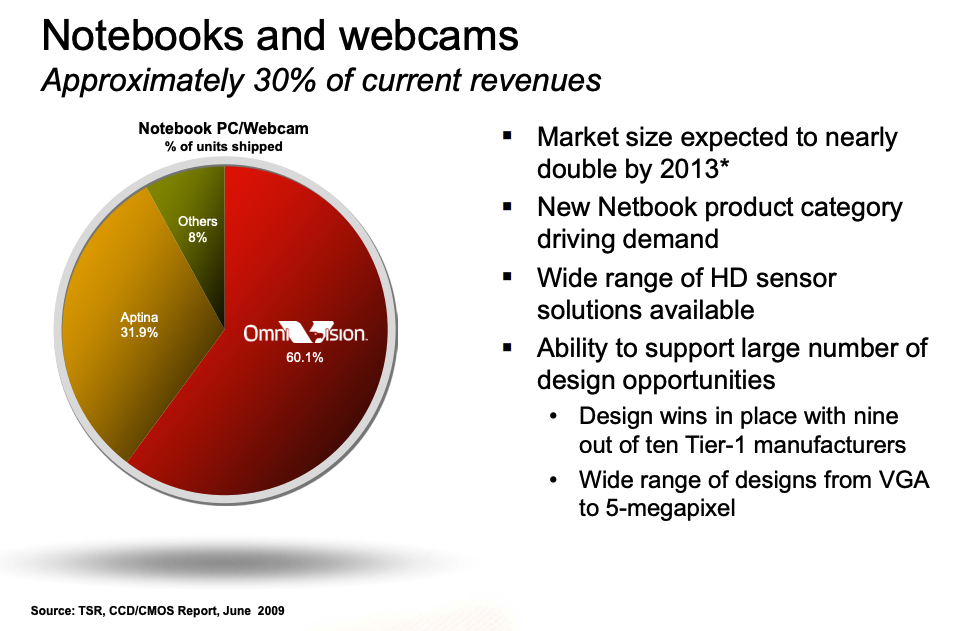
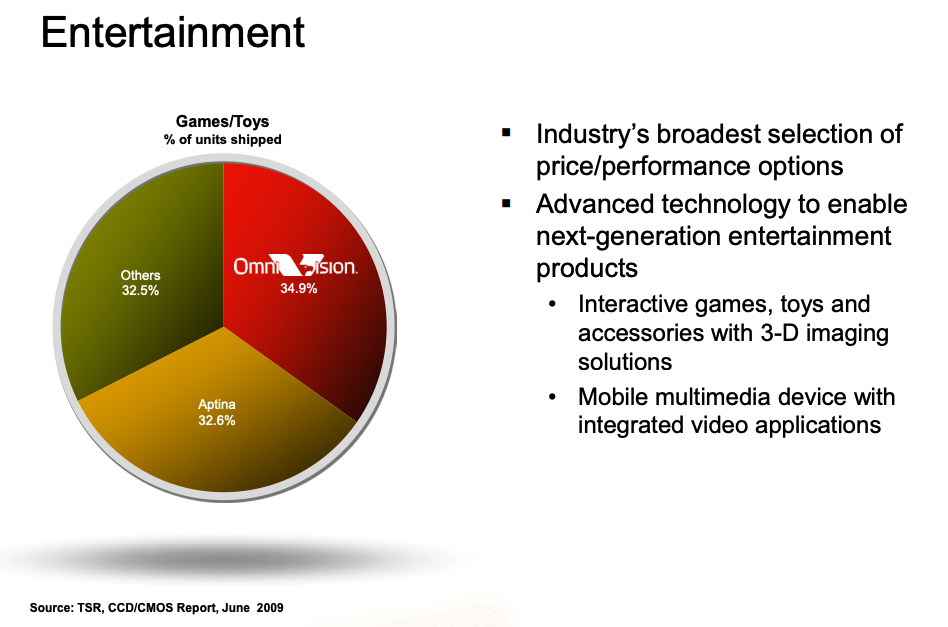
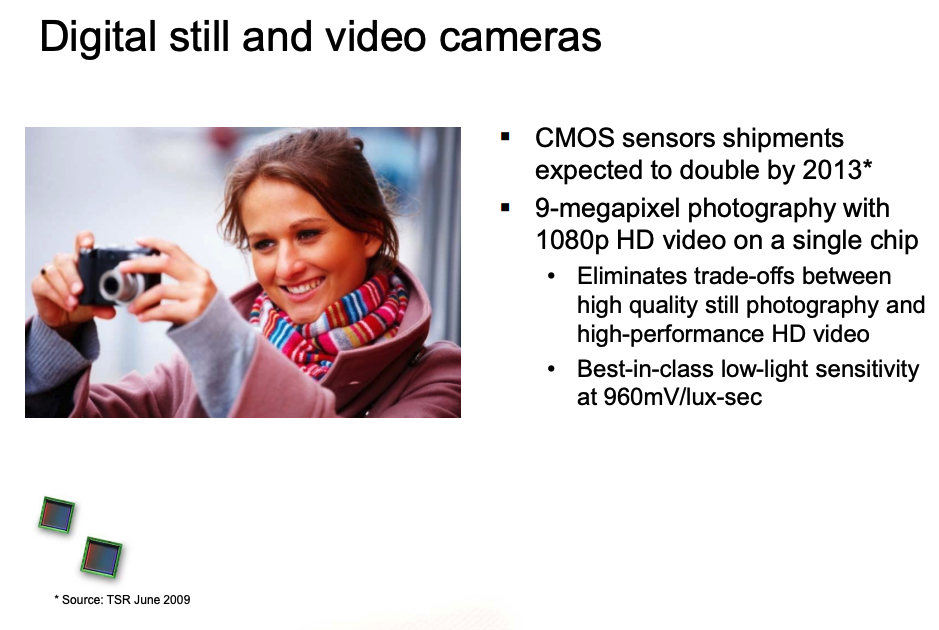

Financial results
F1Q 2010
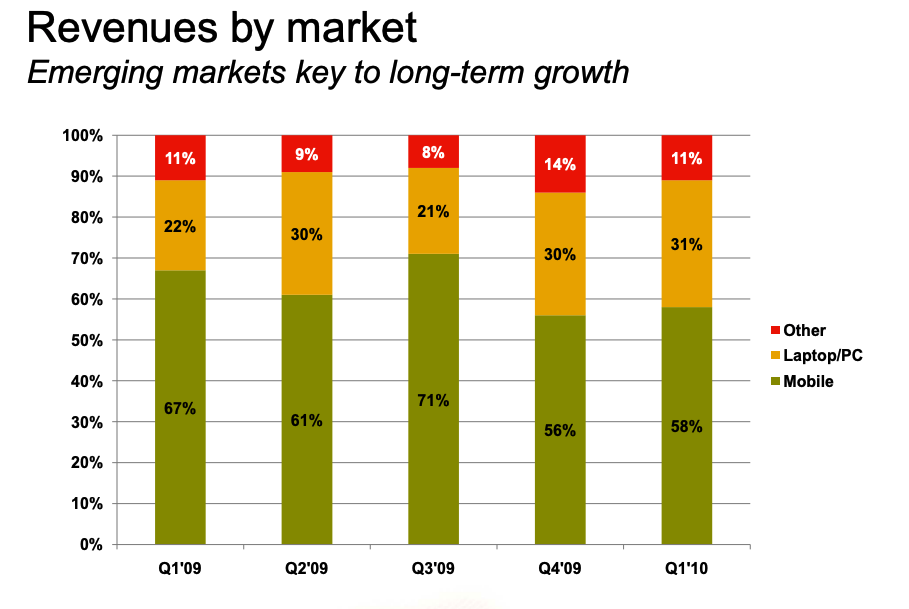
- Revenues of $105.6M in F1Q10 vs. $89.1M in F4Q09 and guidance of $90-$100 million
– Q1 revenues grew 18% quarter over quarter
– Sequential growth across all markets – particularly in smart phones and Netbooks - F1Q10 gross margin was 22.4%, recovered from 17% in F4Q09
– Improvement in gross margin attributable to shipment of fresh inventory and improvement in product mix
– Expect modest improvement in F2Q10 - Operating expenses of $32.6M
– Reduced by $2.4M primarily due to reduction in NRE
– Expect to keep operating expenses within a tight band on a go-forward basis - Cash / ST investments increased to $309.0M
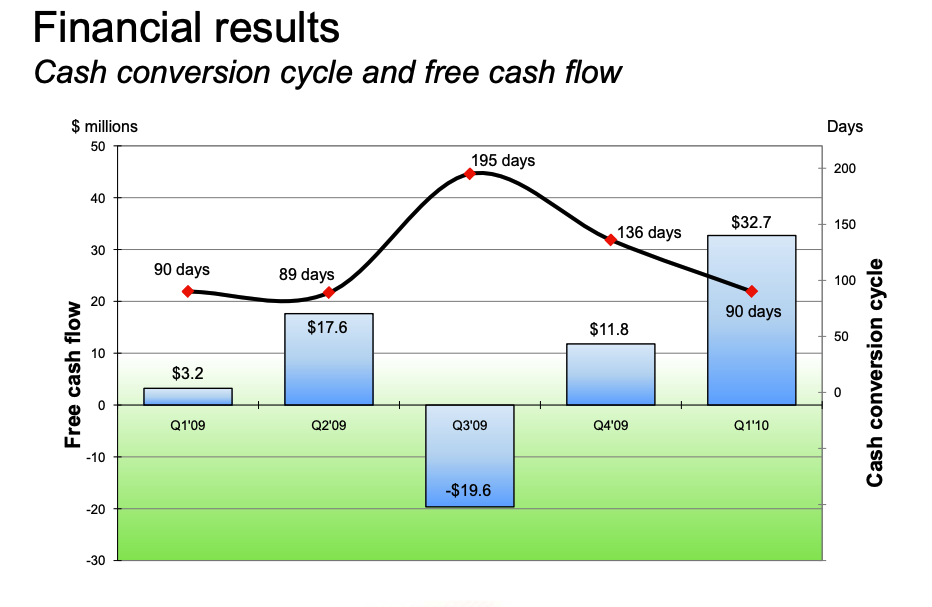
- Accounts receivable with DSO at 42 days
- Inventory with annual turn at 3.3x
Looking ahead
Q2 2010 guidance
- Revenues of $155 ~ $170 million
– Represents additional 47 ~ 61% sequential growth
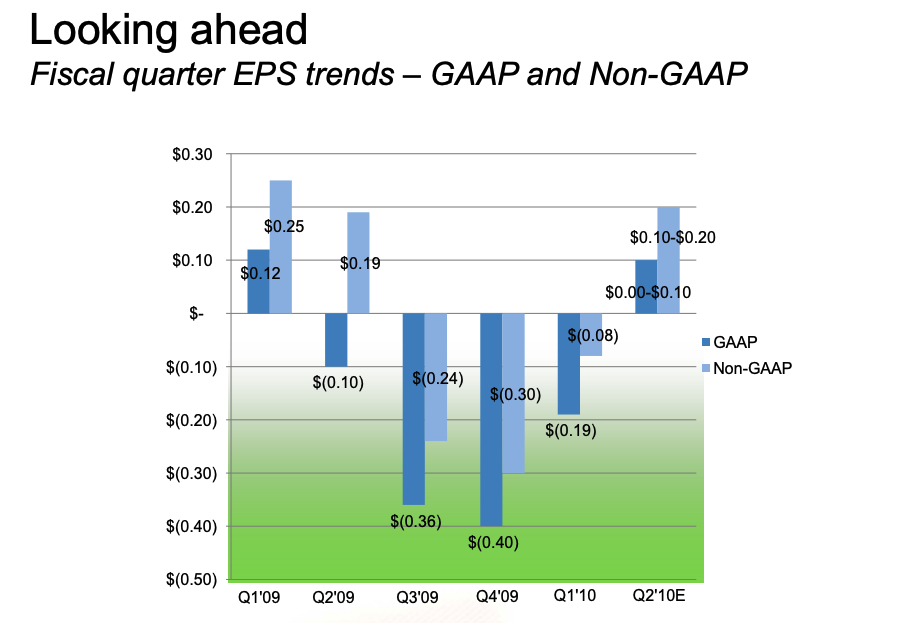
– Returning to profitability well ahead of market expectations
– Enjoying broad-based success across product portfolio - GAAP EPS of $0.00 ~ $0.10
- Non-GAAP* EPS of $0.10 ~ $0.20
*Excludes estimated expense and related tax effects associated with stock-based compensation
